John Gillespie
<John.Gillespie(at)nottingham.ac.uk>
@ is replaced by (at) to stop the automatic garnering of email addresses by Spam factories - Editor
Centre for Developing and Evaluating Lifelong Learning,
School of Education, University of Nottingham (CDELL)
Introduction
The Adult Basic Skills Strategy Unit in the Department for Education and Skills commissioned CDELL to plan and devise two collections of assessment items to form the basis of the National Survey of literacy and numeracy. A profiled sample of 10000 adults aged 16 – 64 are being interviewed in their homes using laptops to present the survey items and store individuals’ responses. The aim is to produce a national profile of adult literacy and numeracy competence over five Literacy and Numeracy Core Curriculum for England and Wales. It is hoped that the results of the surveyhis paper concerns the numeracy part of the survey. The author led the CDELL numeracy team.
Partner organisations
The survey is being carried out by the British Market Research Bureau (BMRB). Associated software has been designed by Bradford Technology Limited (BTL). The numeracy and literacy items and the design of the two surveys are the responsibility of two teams from CDELL.
The main aim of the survey
Much learning and teaching of numeracy with adults in England is now based on the Adult Numeracy Core Curriculum (Basic Skills Agency, 2001). This curriculum is presented in five levels – from lowest to highest these are Entry Levels 1, 2 and 3 and then Levels 1 and 2. Level 2 contains content corresponding to the Key Skills Application of Number level 2 specifications (t is broadly comparable in technical demand to aspects of Intermediate level GCSE mathematics,
while Entry Level 1 contains content comparable to the curricula and attainment of many six and seven year olds.
A main aim of the survey is to produce national estimates, for the first time, of the proportions of the adult population of England currently at each of these levels, which could then be presented by age, sex, location and socio-economic grouping, so as to act as evidence for future comparisons and to inform future educational and training planning and interventions aimed at raising literacy and numeracy levels in England.
Ongoing nature of the work
The survey of a representative sample of approximately 10,000 adults in England commenced in July 2002. It is not likely to be concluded and the results presented by the Department for Education and Skills until the summer of 2003. Until then, individual items may not be made public, nor may any emerging results be published. However, aspects of the survey design, the considerations that led to them and other details of the survey process are not restricted; these form the subject of this paper.
Considerations of the survey population
|
Level
Step number and topic(s) |
E1 | E2 | E3 | L1 | L2 | of which the respondent is presented with |
|---|---|---|---|---|---|---|
|
Step 1
Basic money calculations |
11 12 |
13 | 14 | 4 | ||
|
Step 2
Whole number calculations and time |
21 22 |
23 34 |
25 26 |
27 28 |
29 | 5 |
|
Step 3
Measures and proportion |
31 32 |
33 | 34 | 35 | 36 37 |
2 |
|
Step 4
Weight and scales |
41 42 |
43 | 44 | 45 | 46 47 |
2 |
|
Step 5
Length and scaling |
51 52 |
53 | 54 | 55 | 56 57 |
2 |
|
Step 6
Charts and data |
61 62 |
63 | 64 | 65 | 66 67 |
2 |
|
Step 7
Money calculations |
71 72 |
73 | 74 | 75 | 76 77 |
2 |
|
Total number of items at this level |
14 |
8 |
8 |
7 |
11 |
|
|
Total number of items |
48 |
19 |

Scoring and assessing
The survey is designed to estimate the proportion of respondents at each of five levels:
- at or below Entry Level 1
- at Entry Level 2
- at Entry Level 3
- at Level 1
- at or above Level 2
Individuals would be likely to have performed at different levels of competence on different topic areas. Thus, many respondents' performance records would show a series of correct responses to a set of items set at different levels. What would be the most appropriate method to converting individual performance records into estimates of overall level? Would overall level be best measured by the level of the final two items successfully tackled - that is by the level of successful performance at Step 7? Or should it be based on mean or median performance on the final ten items from Steps 3 to 7? Or should it be based on summing overall performance (scoring 1 for a correct EL1 response up to 5 for a correct L2 response)? In all, five alternative schemes for setting overall level were trialled and these were compared against detailed analysis of individuals' performances from the first 189 respondents' results
The method finally chosen was to sum overall performance, as this took into account all aspects of the respondent's performance. This led to the setting of threshold scores for minimum scores to achieve a particular level. These thresholds were carefully chosen after scrutiny of individual performances from the first 412 respondents and of the performance of individual items. Thus the few items which turned out to have very low or very high facility levels could be allowed for, while final decisions on thresholds for the five levels of performance could be deferred until after the data collection had been completed.
To confirm this method of estimating level, levels were then re-calculated using level estimates based on performance on the 'final ten' and 'final eight' items. Overall proportions using the three methods were found to be very close to each other.
Likely publication of results
It is unlikely that the data collection will be completed before late spring 2003. It is therefore is most unlikely that results will be made public by DfES until the summer of 2003. It is hoped that it will be possible to present further details of the survey at the ALM-10 conference.
In addition to the proportions at each of the five levels, some measure of relative difficulty of different topic areas - and hence of spiky profiles - may be obtainable. Certainly such spiky profiles are evident in individuals' performances to date. In general terms, there appear to be three categories of respondent, - the very small proportion of respondents who remained at or below Entry Level 1, the much larger group who were at Level 1 or 2 throughout, and the majority who found some topics hard and others much easier. Measures of relative difficulty of different topics may possibly be made, but these are compounded by questions to do with the facility of individual items and too much significance should probably not be given to them.
Further research
Although the multiple-choice style of presentation enabled the survey to be adaptive and greatly facilitated the collection and future analysis of the resulting data, the style will only produce limited information concerning individuals’ numeracy capabilities, personal techniques and understandings.
Several possible further research projects immediately suggest themselves. These include presenting the items as short response items to a much smaller sample of adults, then recording and analysing the responses in order to gain insight into methods used to tackle individual items, and then to make comparisons with the multiple choice versions of the items. The same multiple-choice stems could also be re-used, but with alternative distractors.
Acknowledgements
In presenting this paper, the author would like to acknowledge with gratitude the contributions to the project from Linda North and Lynne Tranter in item writing, Iain Cummings and John Winkley (both of BTL), in software design and Dr Jenny Tuson (CDELL) and Joel Williams (BMRB) in data analysis.
References
Basic Skills Agency (2001) Adult Numeracy Core Curriculum , London, Basic Skills Agency.
Coben D., O’Donoghue J., and FitzSimons G. (2000) Perspectives on Adults Learning Mathematics: Research and Practice , Dordrecht, Kluwer
DfEE (1999) A fresh start: Improving numeracy and literacy , London, Department for Education and Employment (now DfES)
Ekinsmyth C. and Bynner J. (1994) The Basic Skills of Young Adults: some findings from the 1970 British Cohort Study , London, Adult Literacy and Basic Skills Unit.
OECD/UNESCO (1994-5 et seq.) International Adult Literacy Survey – IALS. Organisation of Economic Development (OECD), Eurostat, and UNESCO Paris
Qualifications and Curriculum Authority (2000) Key Skills units Levels 1 – 3 . London, QCA
van den Heuven-Panhuisen M. (1994) New chances for paper and pencil tests. Proceedings of 45 th CIEAEM meeting , Caglieri, Italy
van den Heuven-Panhuisen M. (1996) Assessment and realistic mathematics education , Freudenthal Institute, Utrecht.
PISA (2001) Draft Framework for the PISA 2003 mathematics assessment , August 2001 Nijmegen, NL, Programme for International Student Assessment.
Disclaimer
This paper presents the views of the author only.
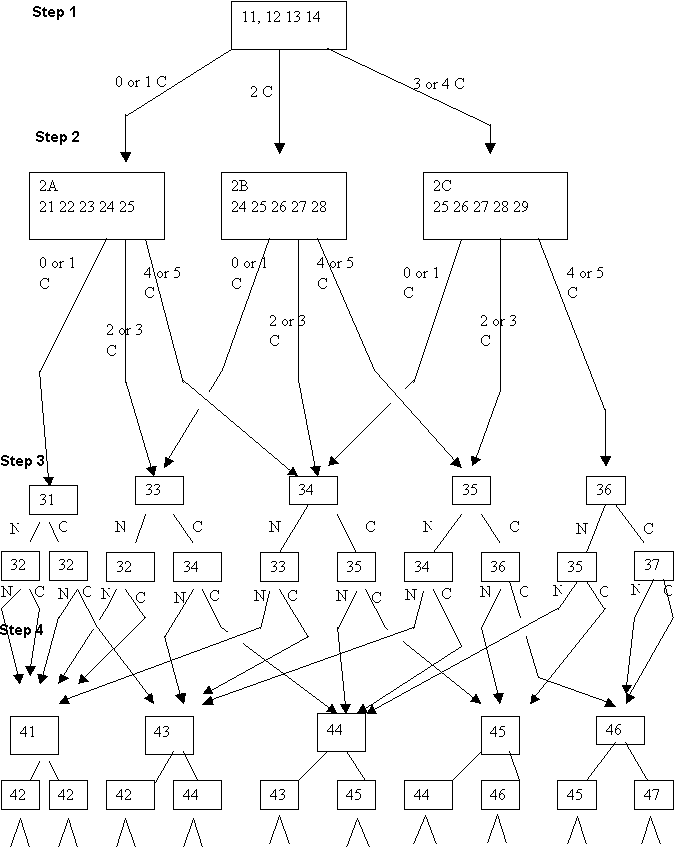
Figure A1 – algorithm for progression between steps
